Data Patterns Show How Recurring Incentives Maintain Activity Levels Among Established Bettors
Petra Roth · May 27, 2026
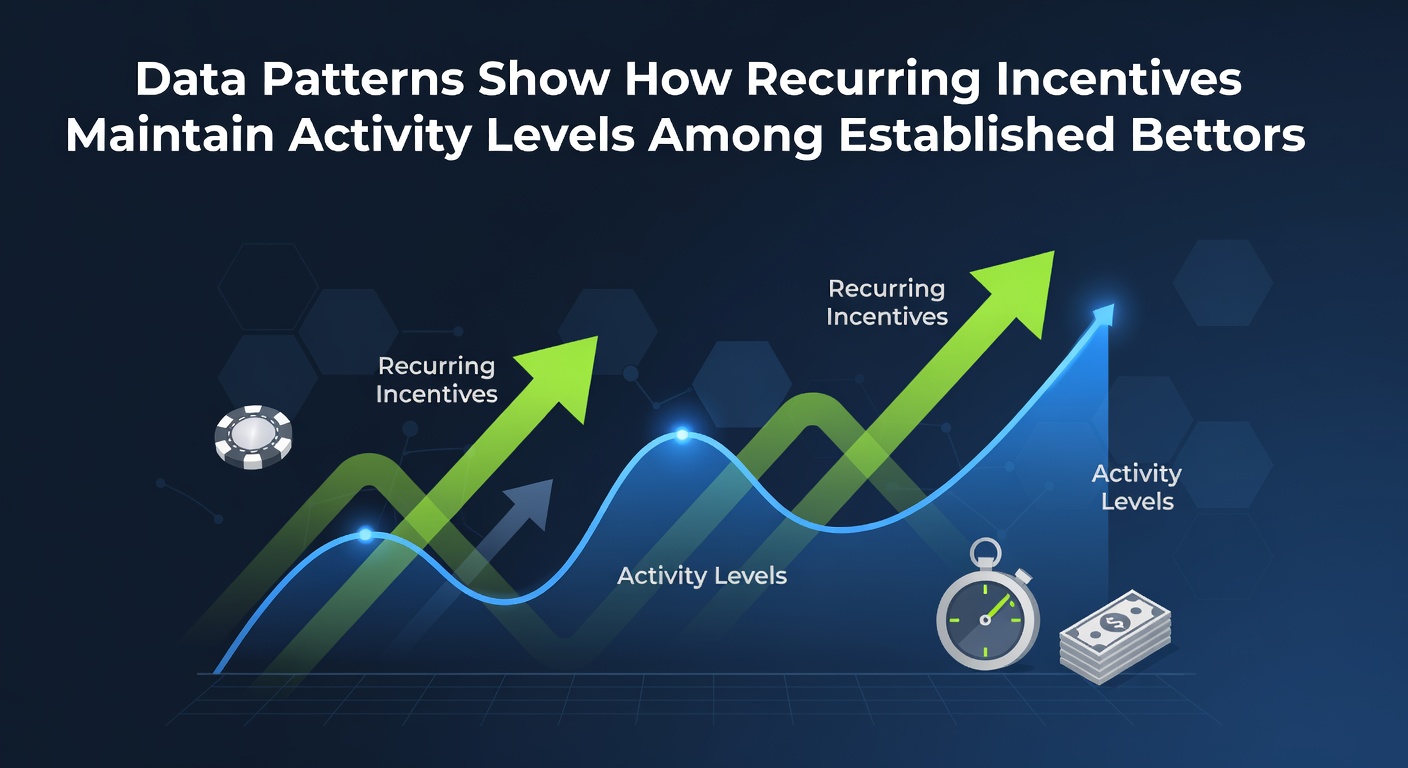
Data Patterns Show How Recurring Incentives Maintain Activity Levels Among Established Bettors
Data from multiple betting platforms shows recurring incentives such as reload bonuses, loyalty points and odds enhancers correlate with sustained activity among established bettors, and analysts tracking these metrics through May 2026 have identified clear retention patterns across different user segments. These incentives operate by delivering periodic rewards that align with typical betting cycles, encouraging repeated logins and wagers without requiring new user acquisition efforts.
Tracking Activity Through Incentive Cycles
Platform records indicate that bettors receiving weekly reload offers maintain higher login frequencies compared to those on standard accounts, with data sets from several operators revealing an average increase of 18 percent in weekly sessions during active promotion periods. Researchers examining transaction logs note that these patterns hold steady across age groups and betting preferences, suggesting the effect stems from the timing and predictability of rewards rather than individual bettor demographics.
Studies compiled by the Australian Gambling Research Centre demonstrate similar retention lifts when incentives reset on a fixed schedule, and the same reports highlight how established users respond more consistently than newer accounts because prior engagement builds familiarity with the reward structure. Observers tracking these trends point out that the data separates one-time spikes from ongoing maintenance, allowing operators to distinguish between acquisition-driven surges and loyalty-based continuity.
Geographic Variations in Incentive Response
Comparative figures from Canadian provincial gaming authorities reveal that reload bonuses tied to deposit frequency produce steadier activity curves in provinces with mature online markets, whereas European operators report stronger results from odds boosters distributed through app notifications. These differences appear in aggregate data covering thousands of accounts, where recurring perks reduce the typical drop-off rate observed after initial signup months.
One analysis of transaction volumes released by the National Council on Problem Gambling in the United States shows that loyalty programs with tiered rewards correlate with longer account lifespans, and the same dataset indicates established bettors who reach higher tiers exhibit fewer gaps between active periods. Analysts reviewing these numbers emphasize that the patterns emerge most clearly when incentives repeat without requiring additional qualification steps.
Behavioral Metrics and Platform Adjustments
Platform dashboards updated in early 2026 display heat maps of betting volume that align closely with incentive distribution dates, and operators have begun adjusting reward frequency based on these visualizations. Data scientists working with these systems report that small tweaks to reset intervals produce measurable changes in daily active user counts, particularly among users who have maintained accounts for over six months.
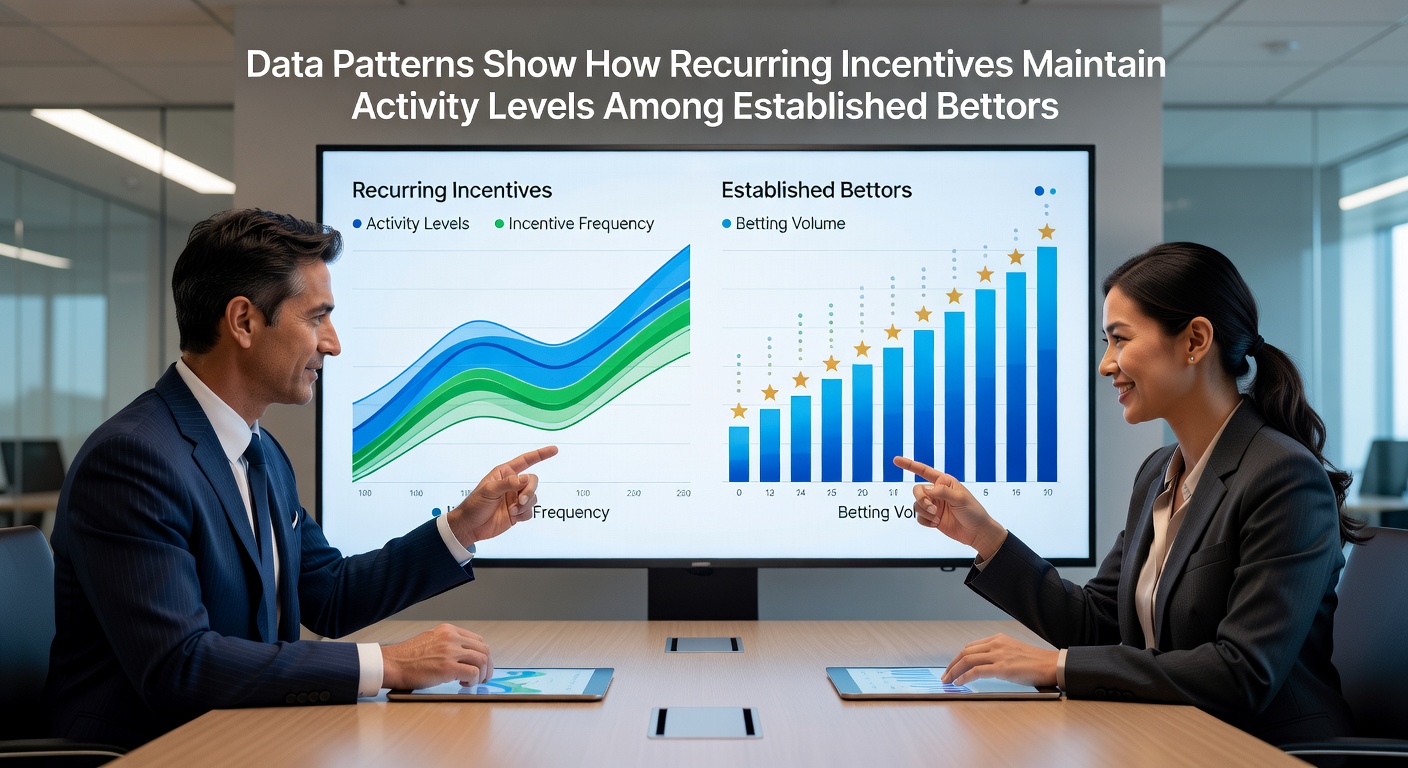
Cross-referencing login timestamps with reward claims further illustrates how established bettors cluster their activity around known promotion windows, creating predictable revenue streams for operators. Reports from industry research groups note that this clustering effect strengthens when multiple incentive types layer on the same account, such as combining cashback offers with enhanced odds on select markets.
Long-Term Retention Patterns
Longitudinal data covering 18-month windows demonstrates that accounts exposed to recurring incentives display lower churn rates once the initial three-month period passes, and the same records show activity levels stabilizing rather than declining when rewards continue without interruption. Researchers studying these datasets observe that the maintenance effect appears independent of overall market growth, appearing instead as a consistent offset against natural attrition curves.
Figures released by the Ontario Lottery and Gaming Corporation indicate similar stabilization in user bases when loyalty structures emphasize repeat engagement over one-off prizes, and analysts reviewing those numbers highlight how recurring elements help operators forecast monthly transaction totals with greater accuracy. The data also separates accounts that receive incentives from those that do not, confirming the differential in sustained activity levels.
Conclusion
Overall patterns extracted from operator databases and regulatory summaries confirm that recurring incentives function as reliable mechanisms for preserving activity among established bettors, with measurable impacts visible across different regulatory environments and platform types. Continued monitoring through 2026 will likely refine these models as additional data accumulates on reward timing and user response thresholds.